
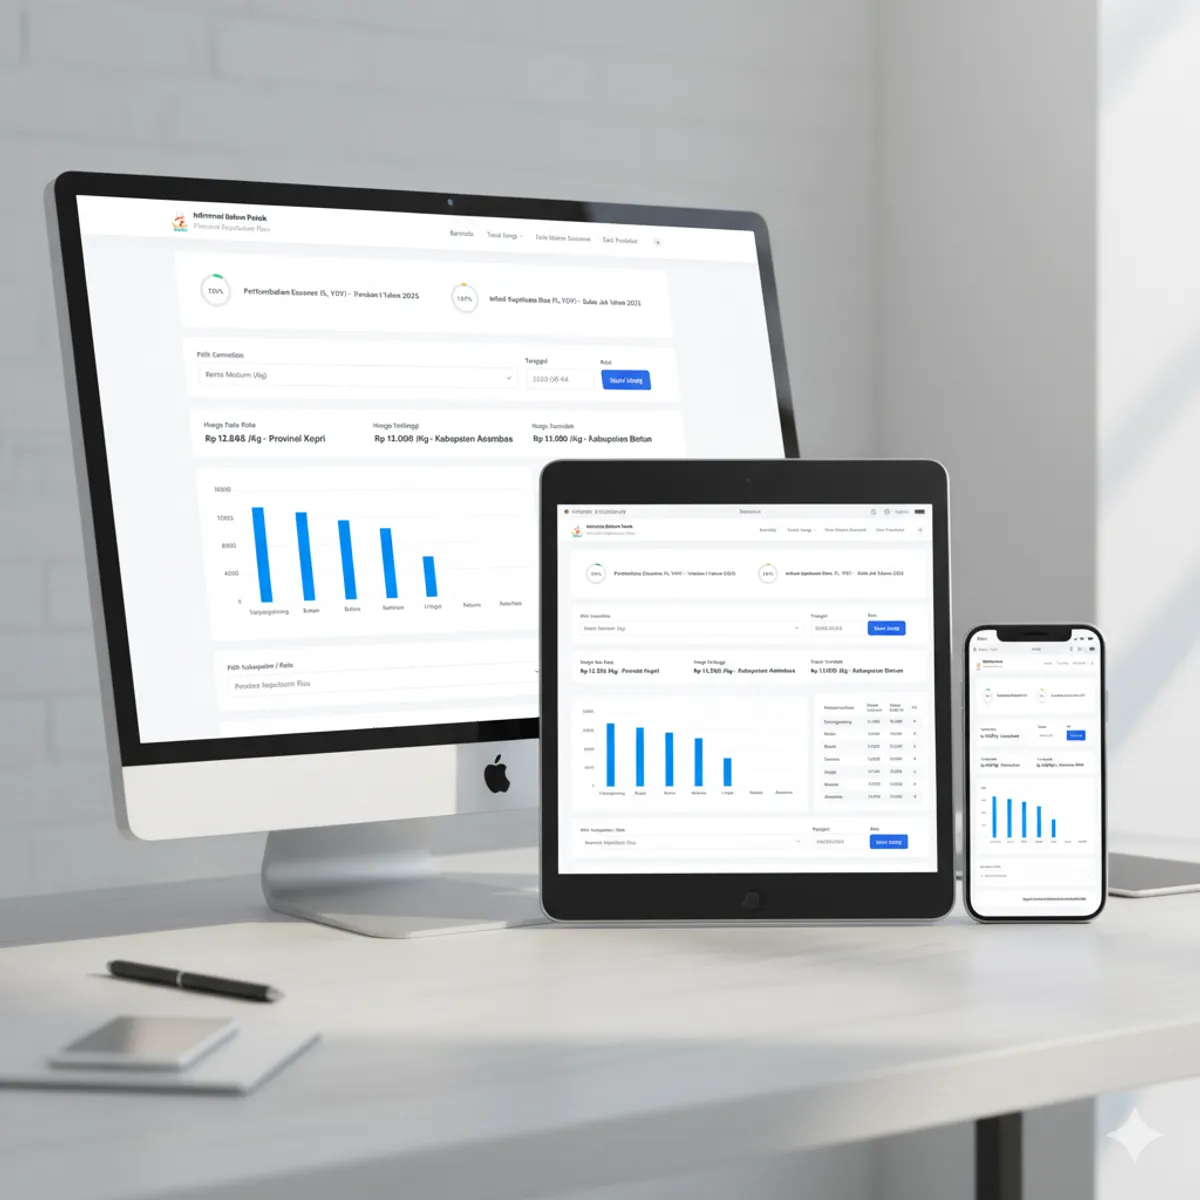
🏛️ Project Governance & Impact
The Basic Commodity Information Platform acts as a centralized digital nervous system for monitoring market stability. By digitizing regional price reporting, it replaces legacy manual reporting with a high-integrity, automated data pipeline used for provincial economic forecasting.
🎯 Key Engineering & Business Achievements
- High-Performance Data Ingestion: Engineered an automated pipeline to process 5,000+ daily data points across multiple commodity categories without system bottlenecks.
- Extreme Low Latency: Optimized backend middleware and database indexing to achieve an average API response time of <150ms, critical for real-time dashboard updates.
- Market Transparency: Empowered government stakeholders with instant price trend visualization, reducing the lag between market fluctuations and policy interventions by an estimated 70%.
- Resilient Full-Stack Architecture: Leveraged Next.js for high-performance frontend rendering and Node.js for scalable backend services, ensuring stability during peak data reporting periods.
✨ Core Analytics Features
📈 Market Intelligence Dashboard
- Dynamic Trend Visualization: Real-time interactive charts showing price movements of basic commodities (Rice, Oil, Sugar, etc.).
- Regional Market Mapping: Geographical data distribution to identify supply chain bottlenecks across different districts.
- Supply Stability Alerts: Automatic flagging of unusual price spikes or supply shortages.
🛠 Technical Architecture
- Real-Time Data Pipe: Robust API architecture designed for high-concurrency data entry and retrieval.
- Relational Integrity: Optimized PostgreSQL schema to maintain complex relationships between commodities, market locations, and time-series data.
- Secure Access Control: Granular role-based access for market surveyors, regional managers, and public users.
🛠 Technology Stack
- Frontend: Next.js 14, React, Chart.js for visualization, Tailwind CSS.
- Backend: Node.js, Express.js (optimized for high-frequency I/O operations).
- Database: PostgreSQL with time-series data optimization.
- DevOps/Tools: RESTful API design, TypeScript for end-to-end type safety.